

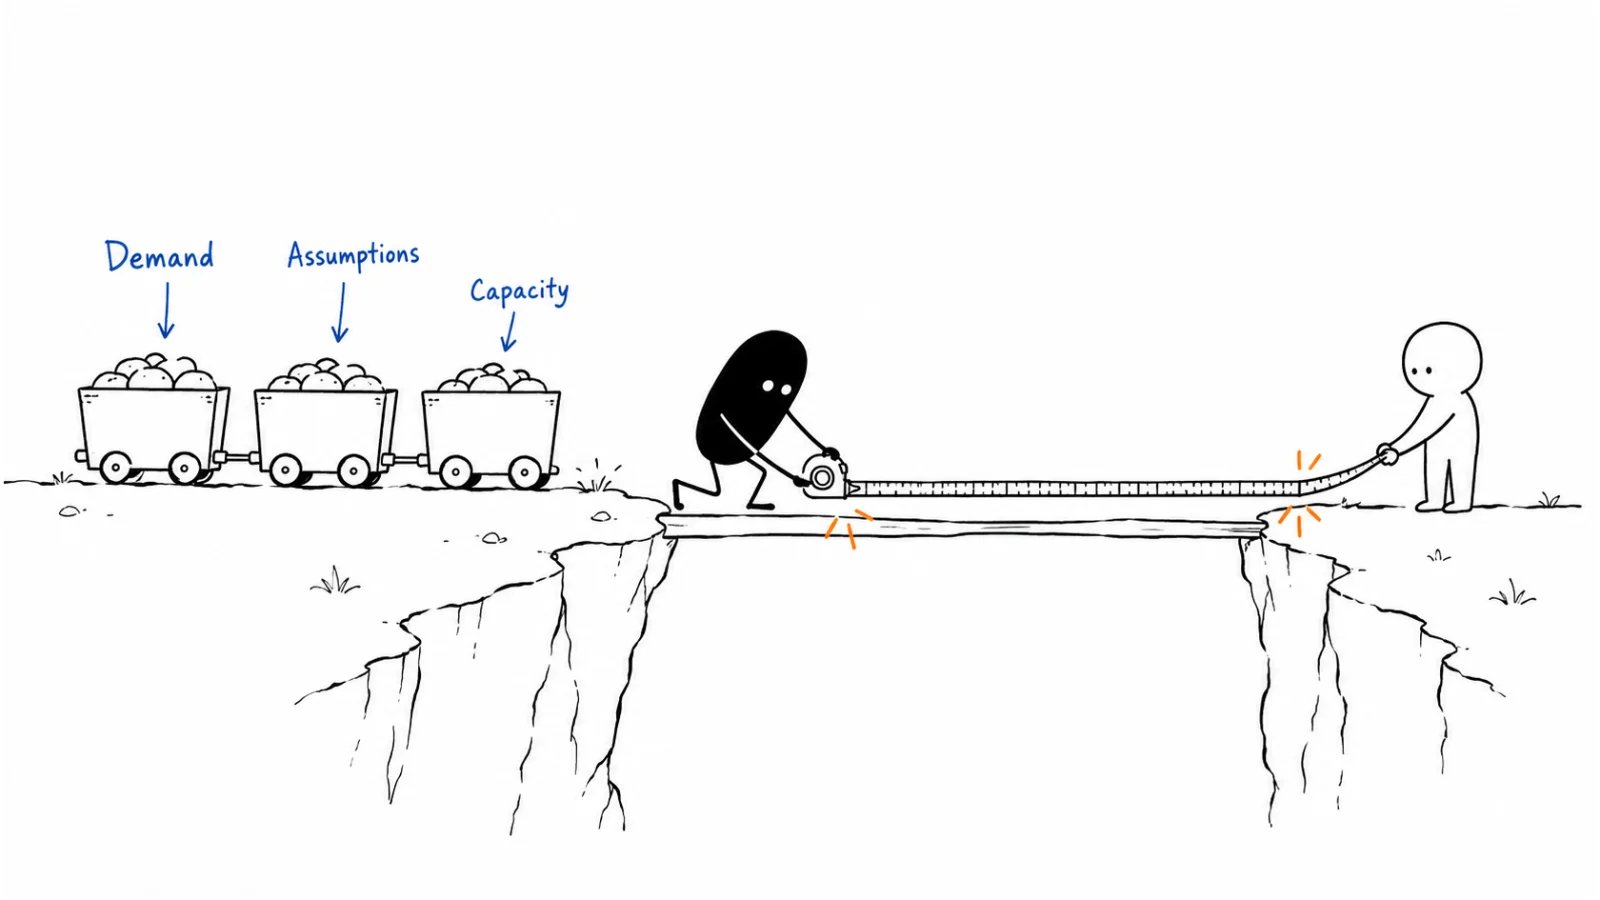
Use this when
- The board number was set before anyone counted ramping AEs or paid conversion.
- Marketing forecasts SQOs from last year’s rates; sales hires as if every AE is at full quota in month one.
- Renewals and NRR are missing, so new logo is asked to fill a hole nobody modeled.
- You found a beautiful sample model and are about to paste its rates into your board deck.
Do not use this when
- There is no ICP and no motion. Stay in first ten.
- You need a weekly call. That is forecasting.
- You need the marketing P&L, monthly headcount, and efficiency diagnostics. That is budget and planning.
- You need a MAP score. That is lead scoring.
- This is securities guidance or a fundraise model for investors. Get qualified owners.
A few useful terms
Keep this in mind
Only change inputs. Outputs are calculated. If you type over a conversion cell because the year “needs” to work, you are writing fiction. Sample rates in any template—including ours—are invented teaching fills, not your funnel.How to do it
Step 0: Start with the strategy
Fill marketing-strategy-inputs.md first. In order:- Rank ICPs by maturity (ICP)—core / scaling / testing / not a priority. Do not fund them equally.
- Name 1–3 marketing advantages you will actually accelerate (channel strategy).
- Lock 3–4 perceptions (content strategy).
- Force-rank four revenue levers with no ties: grow top-of-funnel in an existing audience; grow top-of-funnel in a new audience; increase value per customer; improve efficiency. The ranking forbids work; if everything is #1, nothing is.
- Name 1–3 big bets—projects that could change the trajectory, not the ops that keep the lights on.
- Then write KPO goals (~5–8 lines total) and staff the big bets—see the next step. Only then open the demand and capacity files.
Step 0b: Agree on priorities and major projects
A couple of KPI cells is not a marketing plan. Write three kinds of goals, time-bound, with a why:
Keep the company-facing list short (~5–8). Experiments can live under projects; they do not all need a board slide. Non-goals are written so random requests die.
Each big bet (1–3, often one or two per quarter) names fuel + engine + audience: the perception or offer, the channel engine it rides, the ICP maturity it is for. It must accelerate a named advantage. A bet with no owner, no contingency (product date, hire, budget), and no stop rule is a wish. The demand spreadsheet then has to show whether the year is still possible if the bet slips.
Step 1: Define the funnel stages
Write the same stage names the CRM and forecasting use. Demand plans often start earlier (visit → lead → MQL → SQL → opportunity). Capacity plans often start at SQL or opportunity. Translate; do not run two dictionaries. Stage length in months is an input. Ignoring duration is how January MQLs become January revenue in a cell.Step 2: Estimate demand by channel
Each channel gets: the unit you actually buy or earn (clicks, pageviews, events, outbound accounts), the conversion chain to the stage sales will accept, and cost where it exists. Channels do not share one conversion rate. Organic is not PPC. Events are not SDR outbound. If a channel is zero, leave it zero—do not invent a third-party email program to make the chart pretty. The output you care about is the object sales compensation and forecasting can credit (SQO, opportunity, closed-won)—pick one and stick to it.Step 3: Estimate capacity from the team
For each segment (for example mid-market vs enterprise): quota, first-contract ACV or average deal, ramp months, expected attainment. List AEs with start dates. Quota in a ramp month is not full quota. Count quota-bearing separately from payroll. Overlays (SDR, SE, manager) are ratios you will staff—or honestly under-staff. Attainment is an input you steal from your history, not from a sample 78%. Closed-won count × ACV should be reconcilable with bookings. If the waterfall “wins” do not match capacity bookings, stop. One of the files is lying.Step 4: Include renewals
Contract term, logo churn at renewal, upsell on retained, NRR. Starting customers matter. A company with a book is not a greenfield capacity model. If NRR is below 100%, new logo has to cover the leak and the growth story. Say so.Step 5: Reconcile the plan and record assumptions
Demand SQOs (or wins) versus capacity’s ability to work them: queue time, coverage, waste. If marketing can create 400 SQOs and sales can work 120, you do not need more paid—you need capacity or a tighter score (lead scoring). If sales is staffed for 400 and marketing can create 80, hiring is malpractice. Date the assumption set. The next leader’s 90-day ramp should find this file, not a myth.Worked example (illustrative)
Sales-assist. Two segments. Twelve-month look. Not your rates.Copy: planning one-pager (fill)
- Board / plan number and the period:
- Ranked ICPs, advantages, perceptions, lever order, big bets (or link the strategy-inputs file):
- KPO list (KPI / Project / Ops) and non-goals:
- Each big bet: fuel + engine + audience, owner, contingency:
- Stage names and durations (MM / enterprise or your split):
- Demand: channels in, conversions, cost, output object:
- Capacity: segments, quota, ramp, attainment, start dates, overlays:
- Renewals: starting book, term, churn, upsell, NRR:
- Reconcile note (who is the constraint):
- Assumption freeze date and owner:
Before you start
- Strategy inputs exist: ranked ICPs, 1–3 advantages, perceptions, four levers with no ties, 1–3 big bets.
- KPO list is ~5–8 lines across KPI / Project / Ops; each KPI has an efficiency twin; non-goals are written.
- Each big bet names fuel, engine, audience, owner, and a contingency.
- Stage names match CRM and the forecast page.
- Conversion cells are inputs from your history or an explicit guess labeled as such.
- Ramp months reduce quota; payroll ≠ quota-bearing.
- Duration is in the waterfall, not only conversion.
- Renewals exist if you have a book.
- Demand output and capacity input are the same object.
- Sample numbers from any downloaded model were cleared.
- The constraint (demand vs capacity) is written in one sentence.
Metrics
Do not count model tabs, or a 2023 sample that “looks like SaaS,” as a plan.
Common mistakes
- Typing the output until the year works.
- One conversion rate for every channel.
- Full quota in month one of a six-month ramp.
- Ignoring stage duration.
- Greenfield capacity with 100 customers already on the book.
- Copying another company’s quota, ACV, or 78% attainment.
- Hiring from the capacity sheet while the demand sheet is empty.
- Opening the demand spreadsheet before ICPs, advantages, and levers are ranked.
- Calling a handful of KPI cells a plan, with no project or ops goals.
- Staffing linear work only and hoping a trajectory change appears.
What to read next
When the year is possible but the quarter is chaos, snap the calendars: company cadence. The money that must iterate with this file is budget and planning. Who you hire to staff it is marketing org. Calling the quarter is forecasting. Paying the people is sales compensation. Assumptions in the plan that have not been tested belong in experimentation. A new sales leader should find this file in sales-leadership ramp. Creating the top of the demand sheet is channel strategy plus the motion you named. Scoring who is worth a human is lead scoring. Whether new logo is covering a leak is revenue churn.Sources and evidence boundary
This is an owner-maintained operating synthesis. It is not a financial model for fundraising, not tax advice, and not a benchmark. The demand-plan shape (channel → conversion chain → SQO, rates differ by channel, copy-before-edit) is distilled from an operator demand-generation waterfall spreadsheet (sample year of monthly forecasts). The capacity shape (segment quota, ramp, attainment, AE start dates, payroll vs quota-bearing, overlay ratios, stage duration, renewal/NRR, “change inputs only”) is distilled from operator sales-capacity + waterfall + renewals workbooks (blank model and a filled instance). Those files are method prompts, not sources to copy. Their calendars, dollar quotas, conversion rates, headcount, and#REF! cells are not this library’s facts. The filled instance is treated as one company’s homework, not a default.
Strategy-before-spreadsheet (ranked ICPs, marketing advantages, perceptions, four revenue levers with no ties, 1–3 big bets, then KPO goals) draws on Emily Kramer’s planning series (MKT1, 2024-09-23; 2024-10-02; levers template dated 2023-10-24). KPO as KPI + Project + Ops, the efficiency twin on every volume metric, and “write 10 posts is not a goal” draw on Kramer’s goal-setting essay (MKT1, 2021-09-07), including the later KPO rename noted in that piece. Budget that iterates with this forecast, monthly headcount, and efficiency diagnostics as prompts not SLAs live on budget and planning (MKT1, 2024-12-11). The paid planning docs, OKR sheets, budget calculator, and MCP skills are not reproduced here. DinoCo in the 2024 planning essay is the author’s anonymized teaching case, not a customer of this library.
Copyright © 2026 Ivan Xu. All rights reserved. See the copyright and reuse terms. Canonical source: github.com/weilun88313/B2B-Playbook